The numbers
 I was the new vicar. I wanted to get a sense of the state of the parish. I spend a lot of time talking with people, both in the parish and in the neighborhood. We had group discussions. I read old reports. I listened to the perspective of clergy in the diocese.
Somewhere in there I looked at the record-of-services book. It went back many years. Years of growth and years of decline. But the years just prior to my becoming vicar were different. The services were recorded but no numbers. That a Eucharist was celebrated was there but not the attendance. I didn’t know what to make of it.
I asked parishioners. The most frequent response was along these lines, “Father became depressed. We were getting smaller and smaller. He didn’t know what to do.” Over the years in my work as a consultant I saw the pattern a few more times.
 It’s now become part of the broader culture. We ignore data we don’t like. We avoid looking at data that might make us uncomfortable.
Why do we do that? Maybe it’s that it makes us depressed. Maybe we want to avoid having to change our behavior. Maybe it doesn’t fit our ideology. Think about it—the relationship between wearing a mask and an increase in hospitalizations; or those of us wanting to say our mass gathering doesn’t spread the virus but some other group’s gatherings do; or climate change data and regulation; or gun ownership and concealed carry permit data and the risk of suicide on the one hand and the very low rate of criminal activity by permit holders. If we can’t bend the data to fit our preferred narrative we explain it away or maybe we act like it doesn’t exist. Or maybe we change what we count.
 A dire future
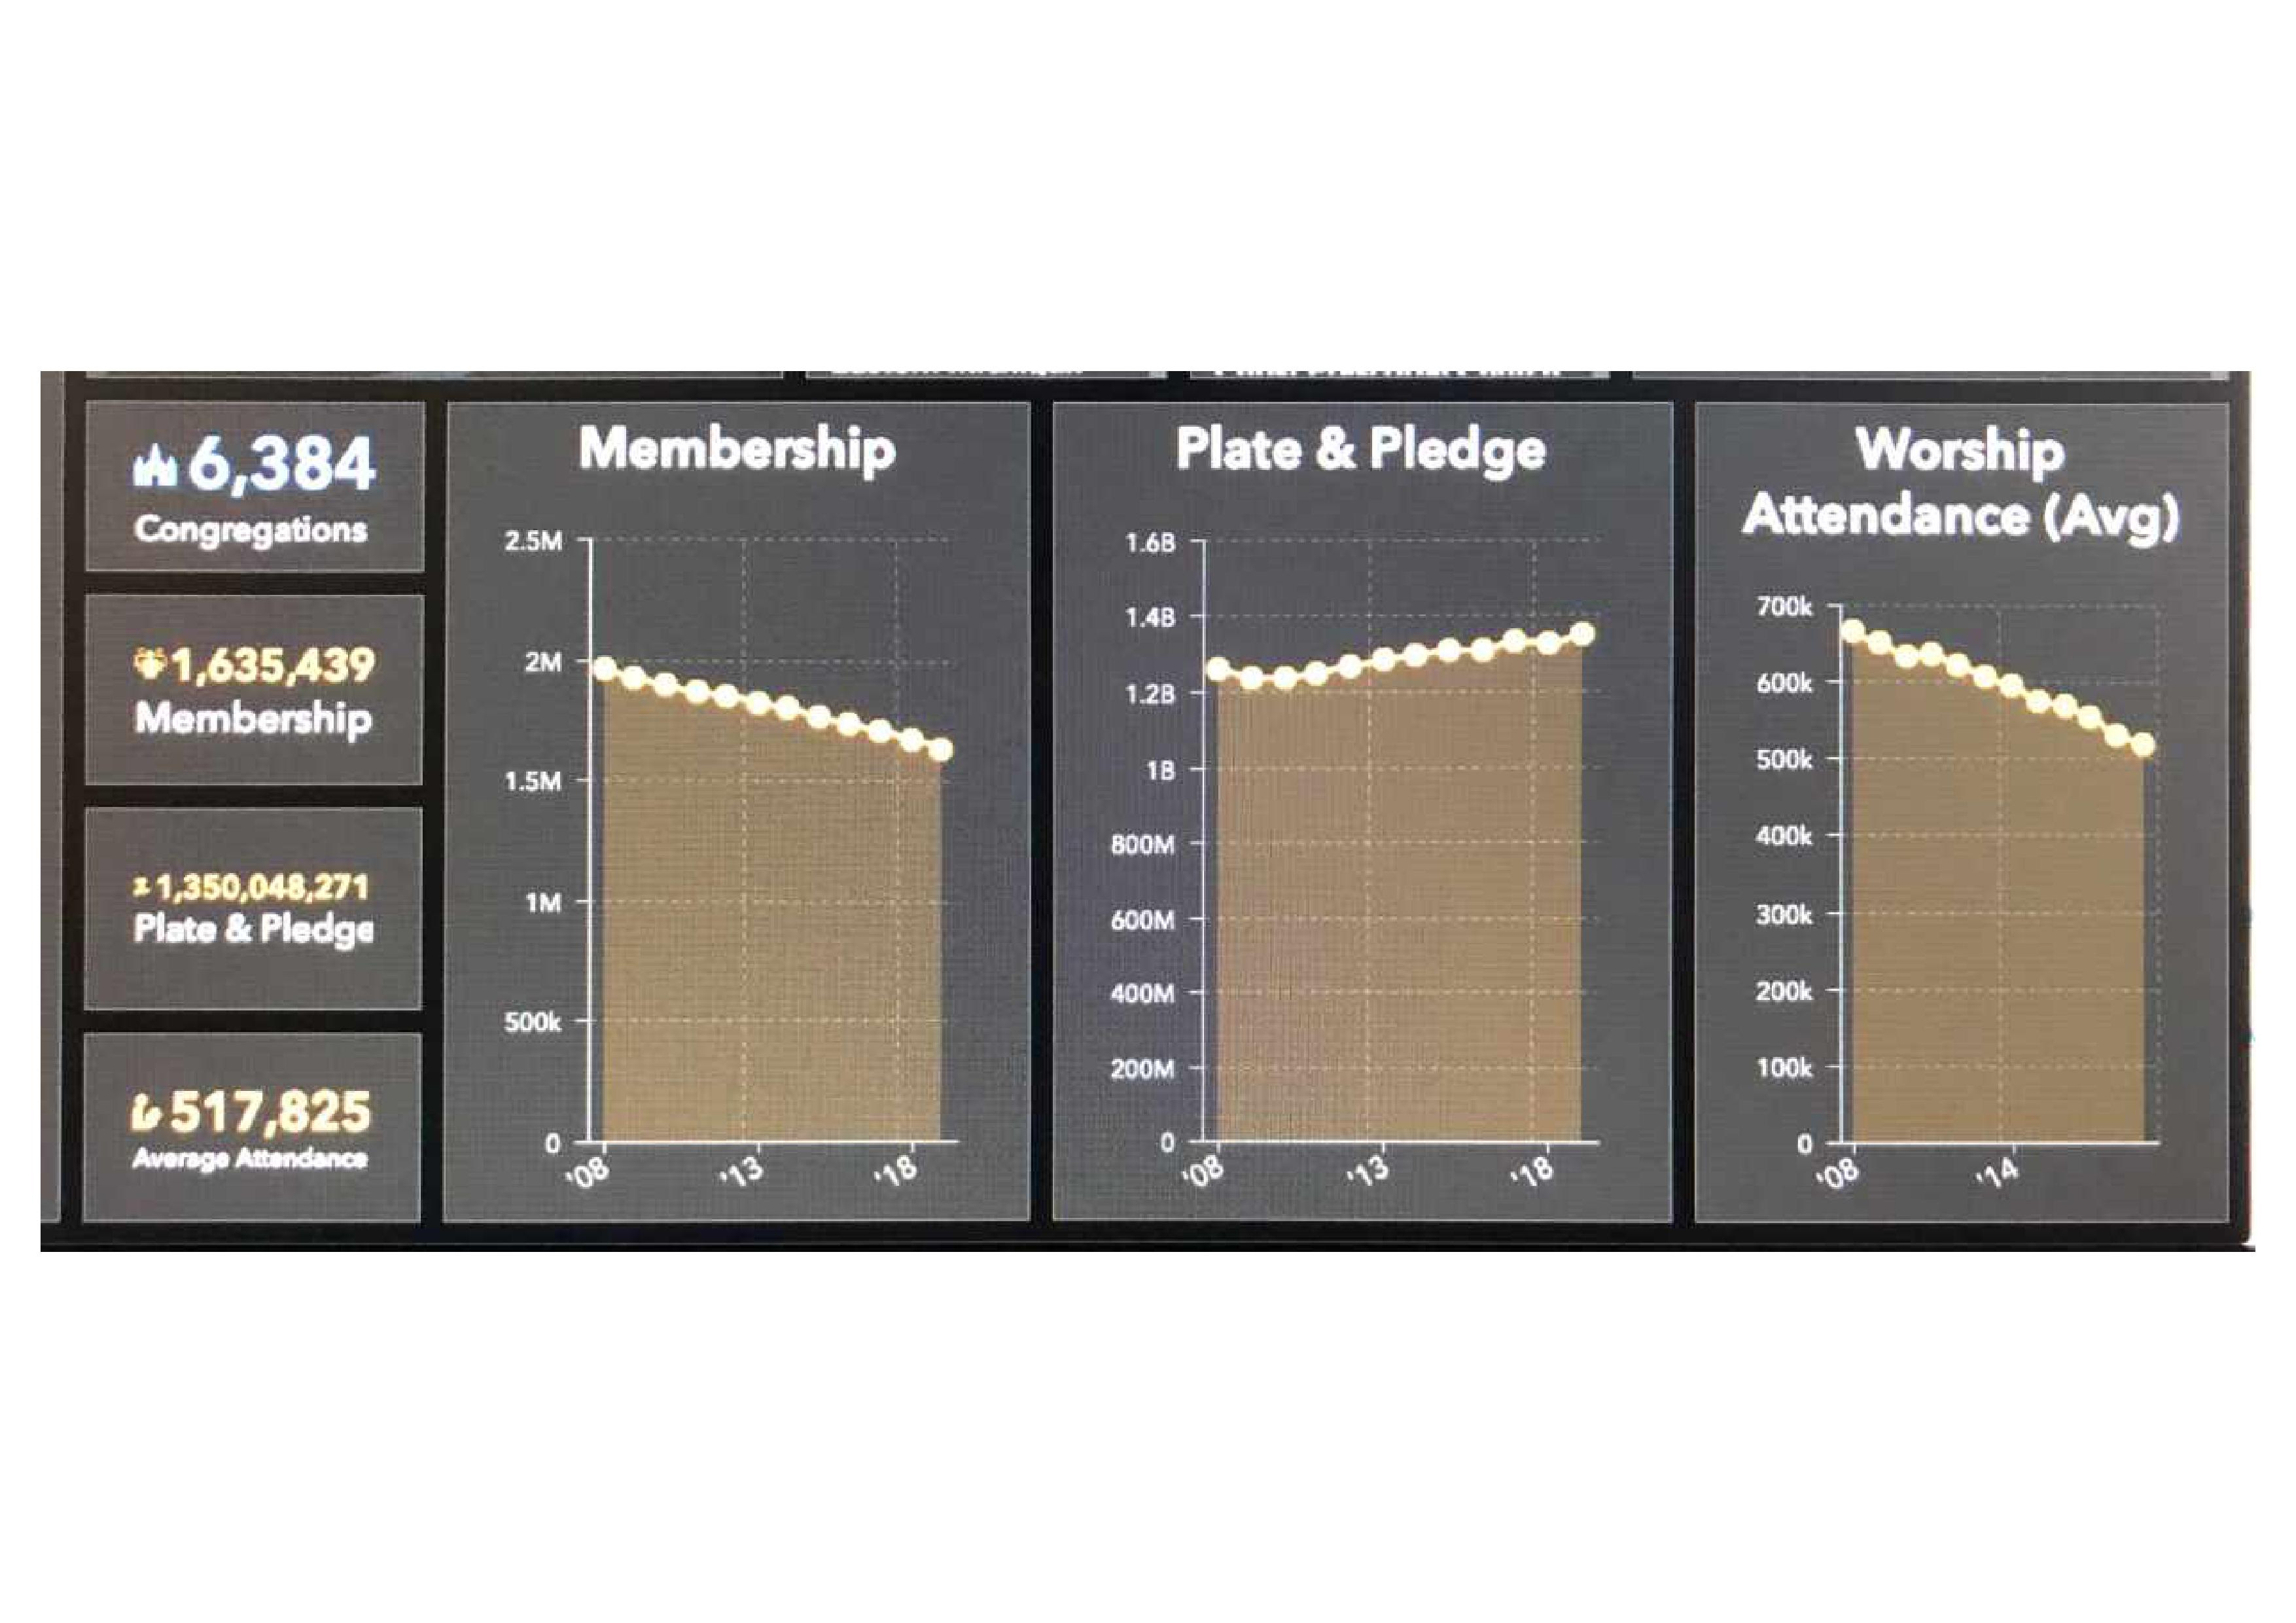
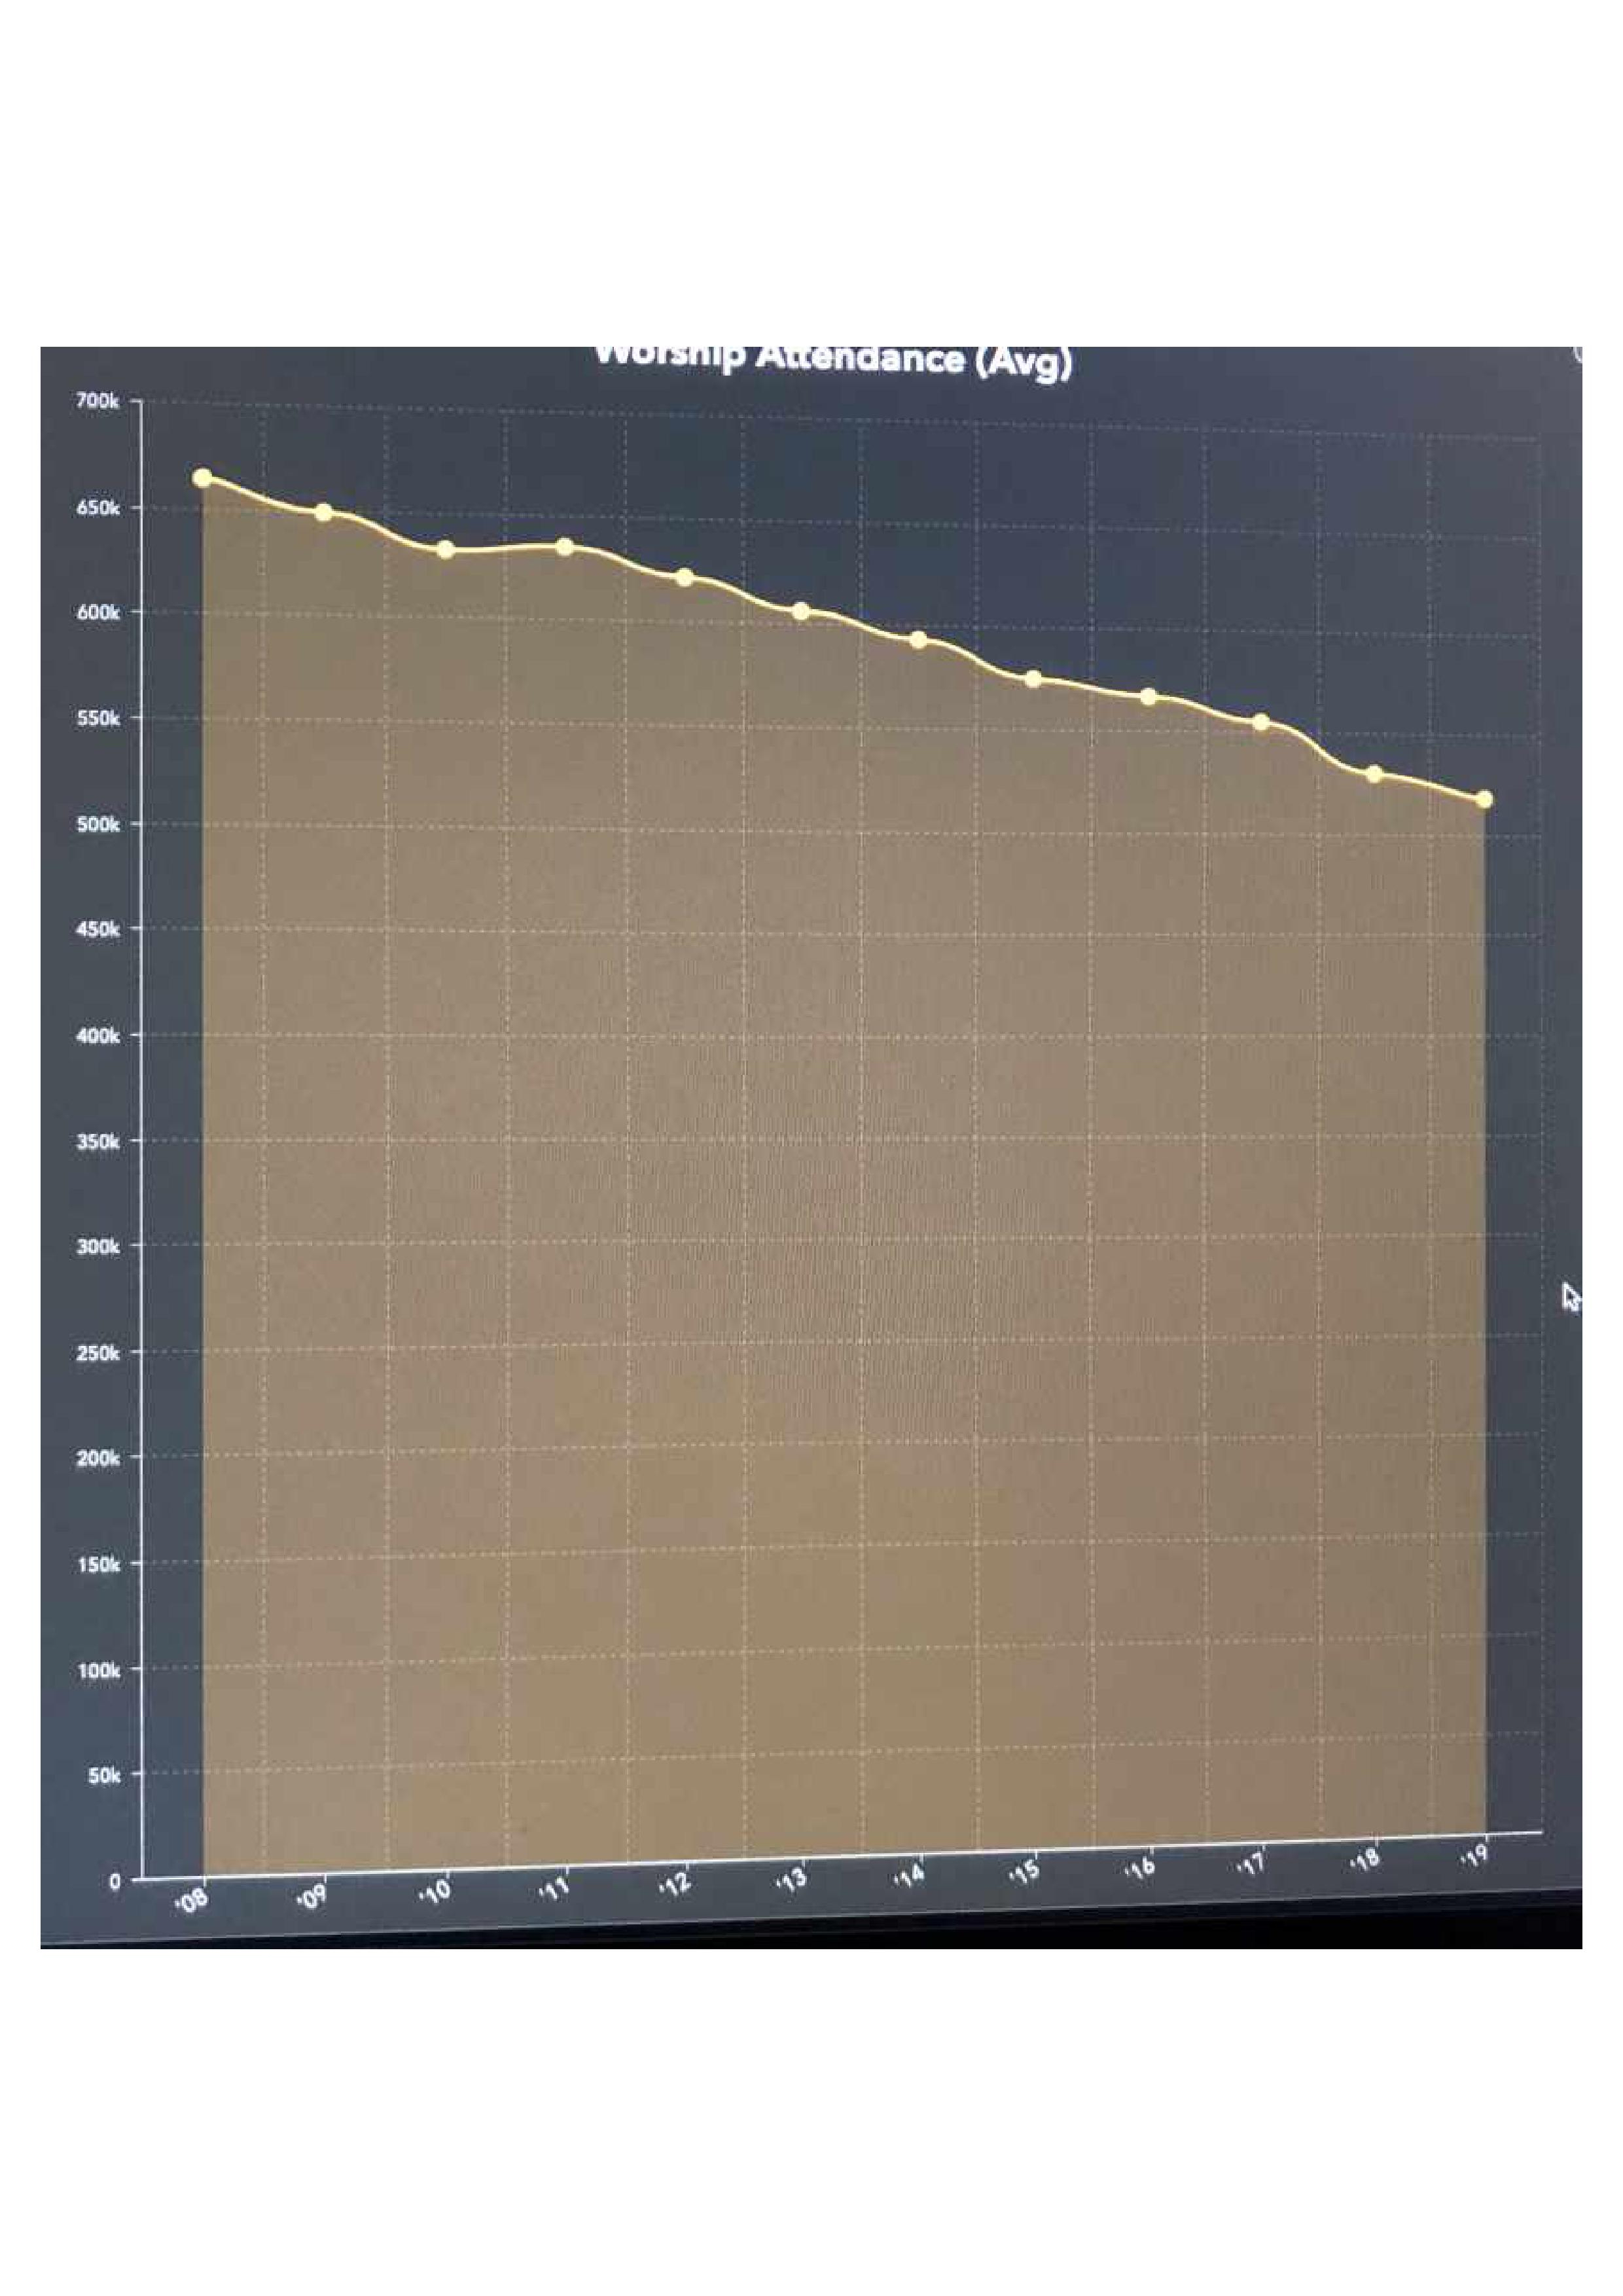
Yesterday’s Episcopal News Service had a reported “2019 parochial reports show continued decline and ‘dire’ future for the Episcopal Church.” The article
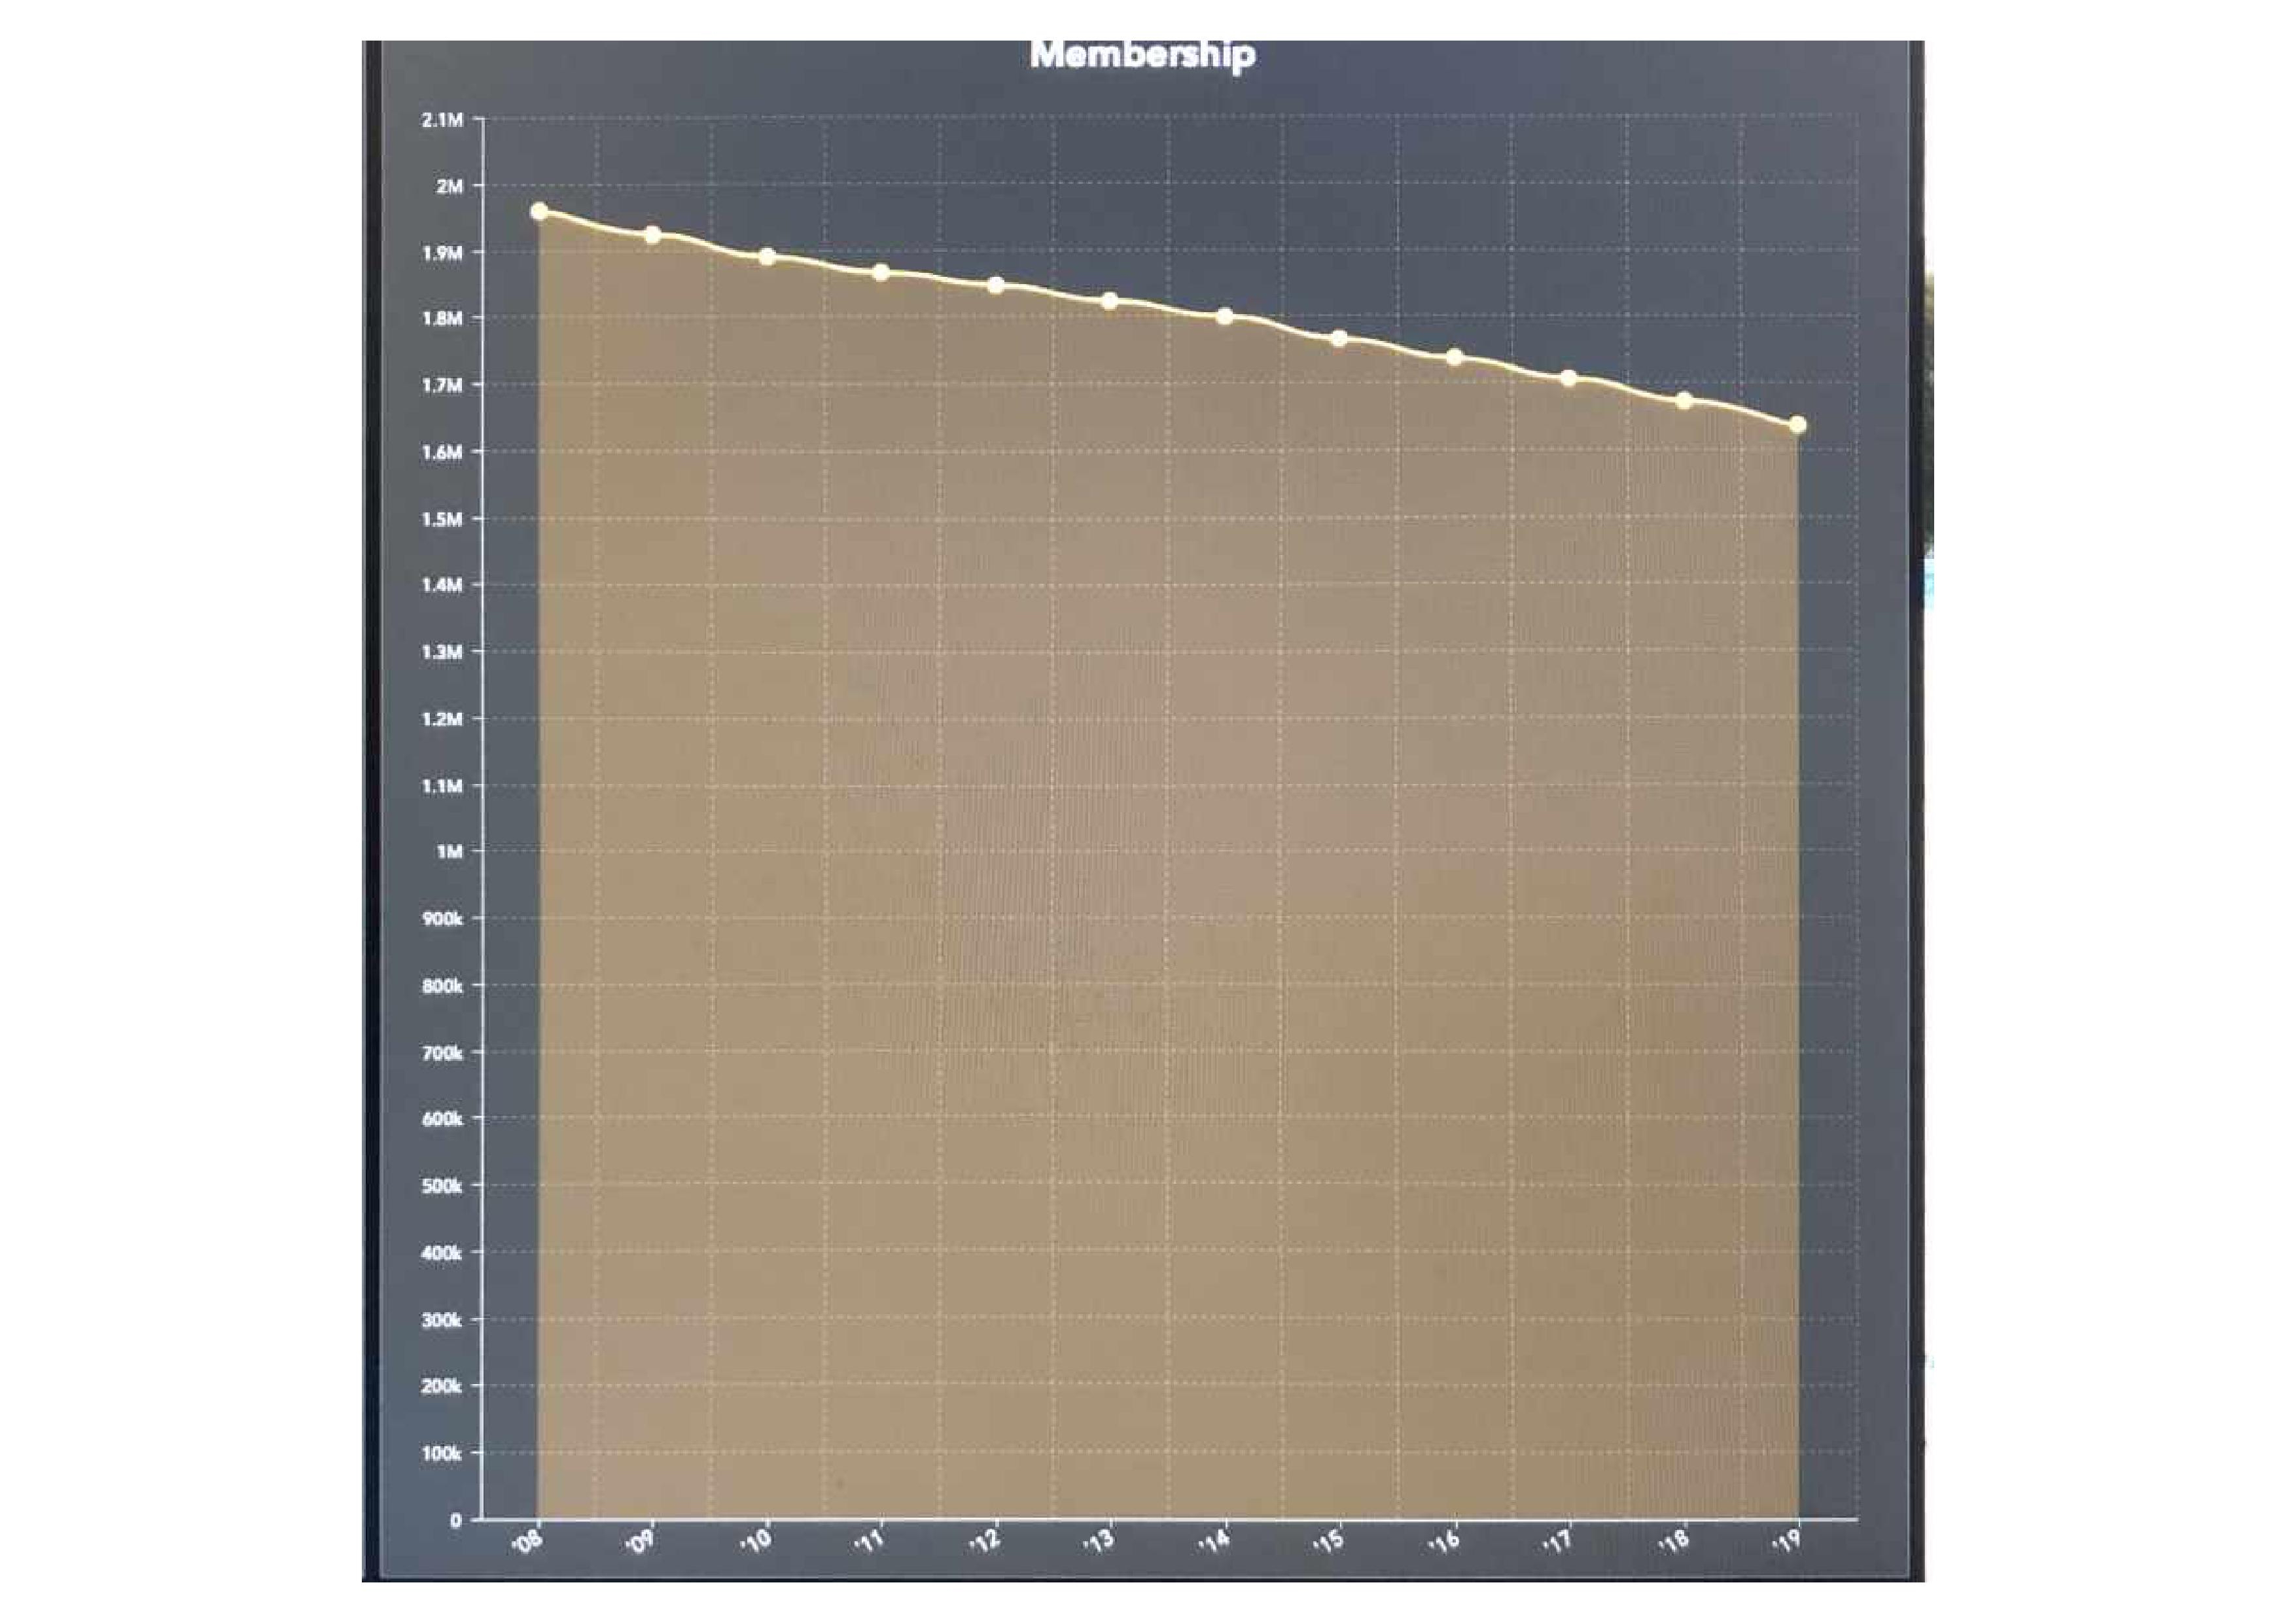
“The Episcopal Church has seen declining membership, to varying degrees, since the 1960s, when it counted 3.4 million members. As of 2019, it had about 1.8 million. Membership is down 17.4% over the last 10 years.”
The new report says, “The release of the 2019 data makes the picture clearer than ever: Even before COVID-19, The Episcopal Church’s days were numbered.” For an hour or so after I read it, I had a feeling of hopelessness in my gut. I thought, “I’m wasting my time writing about ways to nurture healthier parish churches when in a few years we’re dead.” That’s when the memory came of being a new vicar looking at a book of unrecorded numbers because the priest was depressed.
“The Episcopal Church’s days were numbered.” That of course is an interpretation of the data. Look carefully. There are other ways to understand what’s happening. My interest at the moment is about what we measure. Also, about what it means as we look at what we measure--Are we depressed? Are we avoiding? Are we adapting?
What an institution measures is an indication of what it sees, and therefore what it avoids seeing. It connects to what we spend time and money on.
Count the numbers and/or seek a new narrative
The ENS report said this,
 2019 will now be the last year of this particular iteration of the parochial report, the oldest continuous gathering of data by The Episcopal Church. With some adjustments in methodology and definitions, the report has measured membership since 1880 and Sunday attendance since 1991. Even before COVID-19, efforts were underway to redesign the parochial report, and the onset of the pandemic made that even more urgent. For 2020, parochial reports will only measure Sunday attendance from Jan. 1 to March 1 and include new narrative questions to help track “opportunities, innovations and challenges.” After 2020, the new permanent parochial report format may include additions or changes.
Church leaders have said that including narrative sections allows parishes to describe the less quantifiable ways in which they are serving God and their communities, and that membership and attendance numbers alone don’t paint a complete picture of the church.
It’s been in the works for some time. For years now there have been voices that claim, “the Episcopal Church is not in decline.” They want to stress our vibrancy and resilience. Fair enough. But why not say that. Why not hold in front of us both the fact of our decline in attendance and membership alongside the stories of persistence and creativity?
The underlying struggle is there in any institution. Sometimes we avoid the facts and truths that make us uncomfortable, that we don’t know how to respond to, or that don’t fit our ideology or narrative. And at times we exhibit institutional courage and act. In my own history I’ve seen both when the Diocese of Pennsylvania tried to come to terms with its abandonment of the city. See “Stay in the City.” Or the leaders of St. Paul's, Seattle when they were invited to look at the parish's pattern of growth and decline.
An earlier ENS report said,
The special report for 2020 will include new narrative questions to help track “opportunities, innovations and challenges” that congregations experienced while dealing with the pandemic. Racism is another new section in the report, with congregations asked to discuss how they are “actively addressing and working toward racial justice and reconciliation.”
Such narrative questions will preview a new approach to future parochial reports, as Rankin-Williams’ committee responds to complaints that the past emphasis on numbers misses other examples of church vitality and Episcopalians’ participation in the Jesus Movement.
Some concern was expressed by the Rev. Tom Ferguson about the danger of brushing aside the hard numbers. “My fear is, I don’t want a tool that just normalizes decline—which, frankly, I see everywhere, this normalization of decline.”
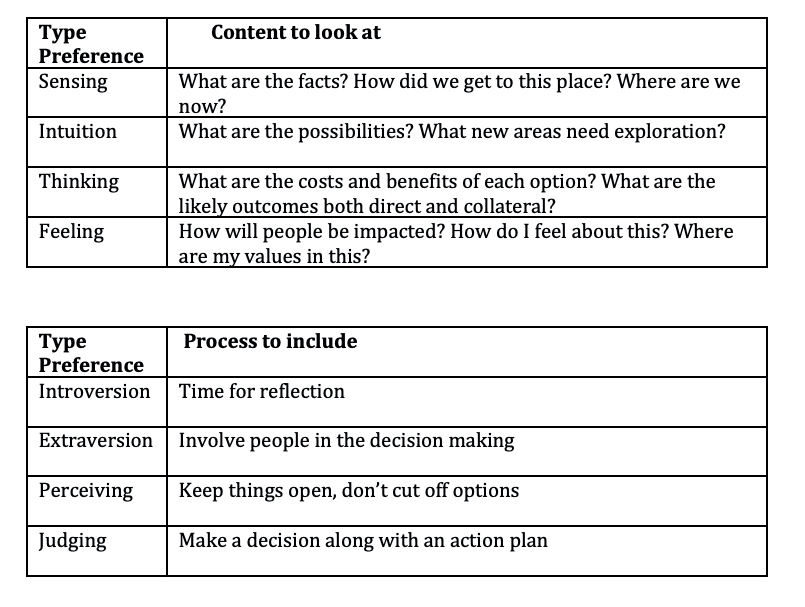
 A Myers-Briggs take on things might go this way--Is what’s happening the victory of intuitive types over sensing types? It’s a tension in most organizations. The church is no exception. Have those more inclined to seeing new possibilities won out over those who ask “what are the facts? The MBTI insight to effective decision making in an organization suggests covering all the bases both in the content and the process. For example,
Individuals and organizations tend to pay more attention to ways of seeing and acting that are most comfortable for them. Using your strengths is reasonable and wise. However, it also means we miss information we need for sound decision making.
With a bit of discipline, we can make better decisions by ensuring that the content of what we look at and the processes that we use cover all the bases.
A healthy and effective approach to coping with problems is the touching on all the preferences.
Another lens we can use in looking at this is Intervention Theory. How do we carry out this work in a way that generates the most internal commitment possible? Are we basing this upon adequate valid and useful information and an exploration of options?
Will we be willing to look at uncomfortable facts and inconvenient truths? Those of declining numbers alongside our responses to racism and the virus.
 Additional measurements – self assessments –needed conversations
In the late 1980s the Diocese of Connecticut required all of its small, struggling, financially aided parishes to participate in processes of self and peer reflection and assessment, meet together on a regular basis, make use of a trained consultant, and have a three-party-agreement on their goals (an agreement among vestry, priest, and bishop). As new priests were appointed, they were required to complete an early form of the Church Development Institute (CDI), in addition to the other requirements. Over a five-year period, the aided-parishes with leaders participating in the CDI training program experienced an 80% average pledge increase (vs. 68% for non-CDI participants) and 24% in attendance (vs. 15%). All these parishes reported increased satisfaction with the central elements of parish life, e.g., worship, formation, service, evangelization, etc. This occurred while the state’s population was declining and as the percentage of the diocesan budget allocated to financial aid to these was also declining.
 The parishes were required to submit a written report in addition to the national parochial report. That included the vestry’s assessment of worship, learning, service, evangelization, and stewardship. The assessments were on a scale from 1 – Much Worse to 5 – Much Improved. Combining such factors with numbers of average attendance, pledge units and average pledge, gave the bishop’s office a clearer picture of the state of the parish and allowed us to open discussions about what assistance we could offer. Equally important was a dynamic it set in motion within the parish. In most cases the assessments set of internal conversations and provided additional energy for needed change.
Hopes
I don’t know what will be asked in the future parochial reports. I have three hopes. 1) That they will expand the range of measurements to include the parish’s self-assessment of critical areas of measurement. 2) That they will maintain the hard data as uncomfortable as that may be. And 3) That they will avoid the type of narrative reporting that is really spin.
rag+
Related resources
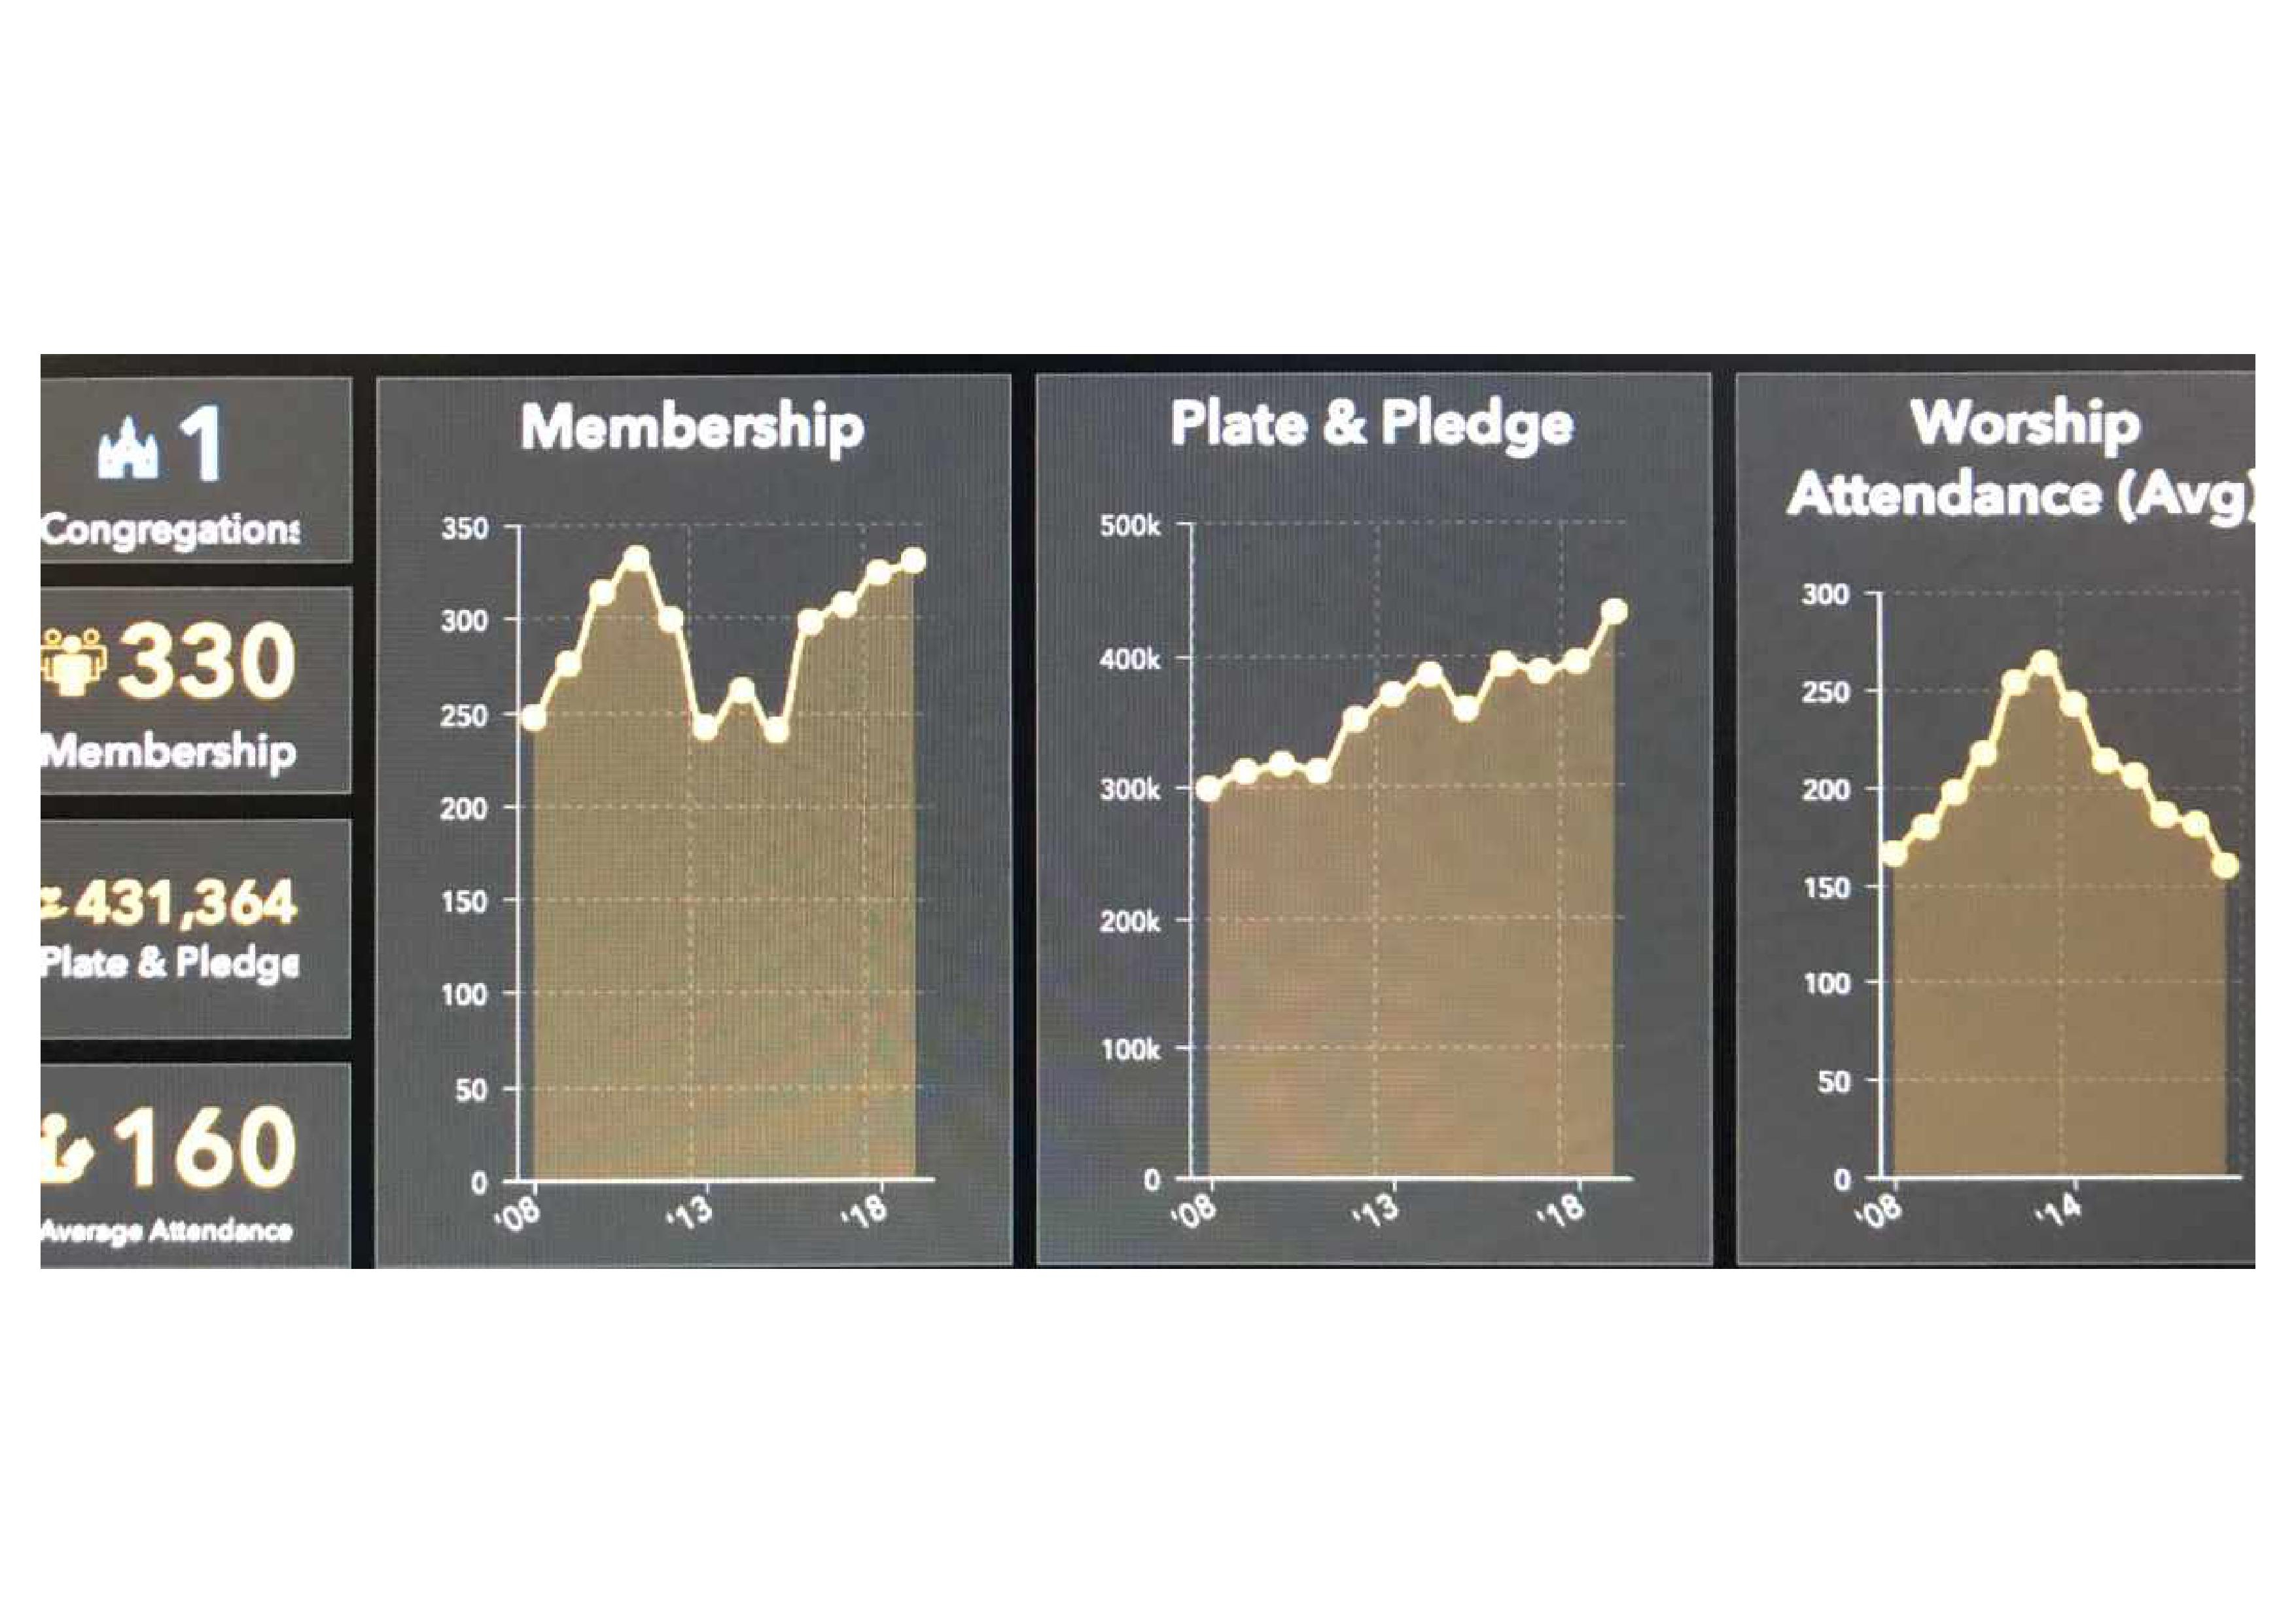
Parochial Report Trends 2008-19 - go to Study Your Neighborhood, then to Explore Parochal Report Trends.
2014 Report on Episcopal Church Growth and Decline
2019 Saint Paul’s Growth & Decline
Understanding from Within: Working with Religious Systems
Measurements I've used
Assessing the Parish's Spiritual Practices
Incorporation Process Assessment
Evangelization and Growth Assessment
 Share Article